Note
Go to the end to download the full example code
Modified Himmelblau function#
If you are running this notebook locally, make sure you’ve followed steps here to set up the environment. (This environment.yml file specifies a list of packages required to run the notebooks)
# -------------------------------------------------------- #
#                                                          #
#     Uncomment below to set up environment on "colab"     #
#                                                          #
# -------------------------------------------------------- #

# !pip install -U cofi geo-espresso
# !git clone https://github.com/inlab-geo/cofi-examples.git
# %cd cofi-examples/examples/test_functions_for_optimization
import numpy as np
import matplotlib.pyplot as plt
import matplotlib.colors as colors
from matplotlib.animation import FuncAnimation

import arviz as az

from cofi import BaseProblem, InversionOptions, Inversion
from cofi.utils import QuadraticReg

np.random.seed(42)
# display theory on the inference problem
from IPython.display import display, Markdown

with open("../../theory/opt_himmelblau_func.md", "r") as f:
    content = f.read()

display(Markdown(content))
<IPython.core.display.Markdown object>
Analytical solution#
We first use sympy https://www.sympy.org/ to find the minimum of our modfified Himmelblau function.
import sympy

x,y =sympy.symbols("x y")
f=(x**2+y-11.0)**2+(x+y**2-7.0)**2+(x-3.0)**2+(y-2.0)**2
gradient = sympy.derive_by_array(f, (x,y))
stationary_points = sympy.solve(gradient, (x,y))
print(stationary_points)
[(3.00000000000000, 2.00000000000000)]
Objective function#
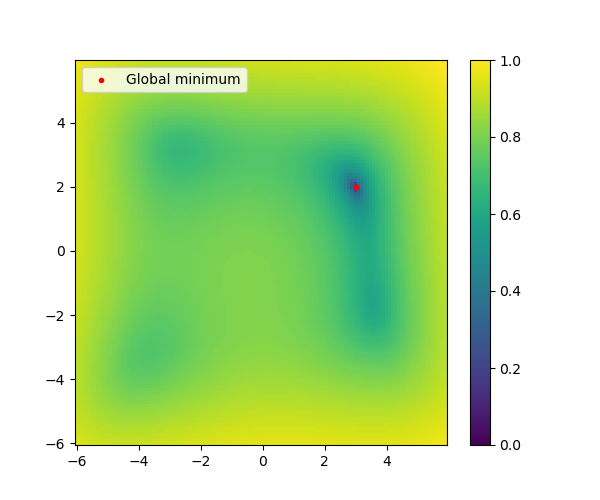
We begin by loading all the required modules and then plot the obejctive function
def modified_himmelblau(x):
    return (x[0]**2+x[1]-11)**2+(x[0]+x[1]**2-7)**2+((x[0]-3)**2+(x[1]-2)**2)
# Initialize figure
fig = plt.figure(figsize=(6, 5))
ax = fig.gca()

# Evaluate function
X = np.arange(-6, 6, 0.1)
Y = np.arange(-6, 6, 0.1)
X, Y = np.meshgrid(X, Y)
Z = modified_himmelblau([X,Y])
im = ax.pcolor(X,Y,Z, norm=colors.LogNorm(vmin=10**-2, vmax=Z.max()))
im = ax.scatter(3,2,color='red',label="Global minimum", marker='.')
ax.legend(loc='upper left')
fig.colorbar(im)

<matplotlib.colorbar.Colorbar object at 0x7f824ba3c880>
BFGS#
Use BFGS and \((-1,-1)\) as the intial model which will result in a local minimum being found.
# Define the Base Problem
inv_problem = BaseProblem()
inv_problem.name = "Modfified Himmelblau Function"
inv_problem.set_objective(modified_himmelblau)
inv_problem.set_model_shape((2))
inv_problem.set_initial_model([-1,-1])
# Define the inverse options
inv_options = InversionOptions()
inv_options.set_tool("scipy.optimize.minimize")

# Run the inversion
inv = Inversion(inv_problem, inv_options)
inv_result = inv.run()
inv_result.summary()
============================
Summary for inversion result
============================
SUCCESS
----------------------------
fun: 71.84222128219835
jac: [-9.53674316e-06  2.86102295e-06]
hess_inv: [[0.01084335 0.00361916]
 [0.00361916 0.01428301]]
nfev: 48
njev: 16
status: 0
message: Optimization terminated successfully.
nit: 10
model: [-3.61235325 -3.10165561]
Border collie optimisation#
Use CofI’s implementation of Border Collie optimisation which gets us into the vicinity of the global minimum.
inv_problem = BaseProblem()
inv_problem.name = "Modified Himmelblau Function"
inv_problem.set_objective(modified_himmelblau)
inv_problem.set_model_shape((2))
# Define the inverse options
bounds= ((-6.0,6.0),(-6.0,6.0))

inv_problem.set_bounds(bounds)

inv_options = InversionOptions()
inv_options.set_params(number_of_iterations=100)
inv_options.set_tool("cofi.border_collie_optimization")

# Run the inversion
inv = Inversion(inv_problem, inv_options)
inv_result = inv.run()
array([3.01215092, 2.09835251])
Next we plot the states of the flock of sheep and the pack of dogs. We can observe how the lead dog goes to a minimum (i.e. the farm) and once it has arrived there it runs away to gather more sheep. Similarly the sheep get herded towards the global minimum.
n=len(inv_result.pack_position_history)
fig, ax = plt.subplots(n//2, 2)
fig.set_size_inches(10,5*n//2)
dmarkers=["v","o","s"]
dlabels=["lead dog","left dog","right dog"]
for i in range(n):
    ax[i//2,i%2].pcolor(X,Y,Z,norm=colors.LogNorm(vmin=10**-2, vmax=Z.max()))
    # Plot that point using the x and y coordinates
    pack=inv_result.pack_position_history[i]
    flock=inv_result.flock_position_history[i]
    dmarkers
    for j,dog in enumerate(pack):
        ax[i//2,i%2].scatter(dog[0],dog[1], color='red', label=dlabels[j], marker=dmarkers[j])
    for j,sheep in enumerate(flock):
        if j==0:
            ax[i//2,i%2].scatter(sheep[0],sheep[1], label="sheep",color='black', marker='.')
        else:
            ax[i//2,i%2].scatter(sheep[0],sheep[1], color='black', marker='.')

    # Set the x and y axis to display a fixed range.
    ax[i//2,i%2].set_xlim([-6, 6])
    ax[i//2,i%2].set_ylim([-6, 6])
    ax[i//2,i%2].legend(loc='upper left')

Watermark#
watermark_list = ["cofi", "numpy", "scipy", "matplotlib"]
for pkg in watermark_list:
    pkg_var = __import__(pkg)
    print(pkg, getattr(pkg_var, "__version__"))
cofi 0.2.7
numpy 1.24.4
scipy 1.12.0
matplotlib 3.8.3
sphinx_gallery_thumbnail_number = -1
Total running time of the script: (0 minutes 5.407 seconds)

